Heterogeneity Analysis of Operating Mode Distribution for Modelling Energy Consumption of Light Duty Vehicles
论文题目:Heterogeneity Analysis of Operating Mode Distribution for Modelling Energy Consumption of Light Duty Vehicles(交通流能耗建模中车辆功率分布的异质性分析)
论文作者:张乐琦,宋国华,张泽禹
论文期刊:Transportation Research Record: Journal of the Transportation Research Board
论文网址:https://doi.org/10.1177/03611981221098397
摘要:使用功率分布来测算车辆能耗和排放已被广泛接受。然而,在使用排放模型默认的功率分布时,驾驶行为的异质性会导致能耗测算时的误差。为了定量的区分驾驶行为差异带来的估算误差,本文采集了26082名驾驶员的工作日逐秒行驶轨迹数据,基于特定速度下的比功率(Vehicle Specific Power, VSP)分布,设计了能够反映驾驶行为的能耗效率指标。基于无监督聚类算法,讨论了能耗效率指标反映出的驾驶行为的组内异质性和组间异质性,这有助于进一步降低轻型车能耗估算的误差。
关键词:驾驶行为,异质性,VSP分布,能耗效率
1 研究背景
目前的交通流能耗模型一般基于默认的车辆功率分布和排放率来计算能耗,但使用默认的功率分布可能无法准确反映实际驾驶中多样的驾驶行为。在同样的交通条件下,轻型车驾驶员的驾驶行为显著规律性差异造成了驾驶员间存在不同的功率分布模式。如果继续使用相同的功率分布模式,对驾驶行为异质性的忽略可能会导致能耗测算的偏差,特别是在微观的能耗测算方面。另外,燃油车、电动车和混合动力车都属于轻型汽车,但电动车和燃油车之间的功率分布存在稳定而显著的差异。随着路网上电动车占比的提高,使用相同的功率分布来测算路网能耗会引发更大的不确定性。
因此,本文利用在北京收集的26082名驾驶员的行驶轨迹数据,基于特定速度下的VSP分布,设计能够反映驾驶行为异质性的能耗效率指标,以衡量在不同交通条件下,轻型车驾驶行为差异在能耗建模时导致的异质性。
2 研究方法
2.1数据来源及预处理
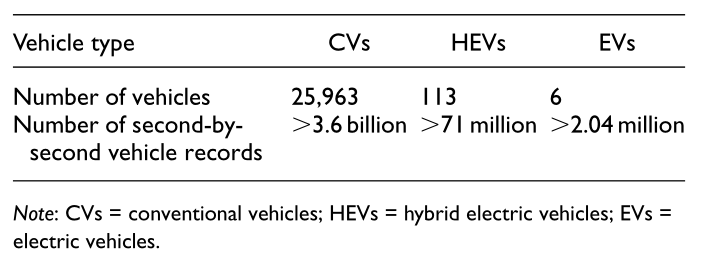
本研究基于2018年6月和2019年6月期间在中国北京收集的26082名驾驶员的逐秒轨迹数据,记录了车辆每次点火后的逐秒发动机数据和GPS数据,共收集了超过60亿秒条记录,覆盖5229516个行程,其中包括车辆ID、经度、纬度、GPS速度以及相应的采集时间。为保证分析的准确性,对数据的连续性和有效性进行检查,将车辆轨迹数据分为180s的轨迹片段,可以包括车辆在道路上和交叉口处的驾驶特征。此外,采用每30秒标记180秒片段的方式,尽可能多地保留驾驶特征。经过数据质量控制,共采用37亿秒的轻型车辆记录、1.03亿个片段来反映不同交通状况下的驾驶行为,车辆数和轨迹数据量如表1所示。
表1 不同类型车辆的数据
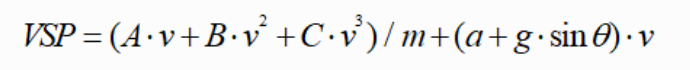
2.2 建立特定速度下的VSP分布
VSP被定义为每单位车辆质量的瞬时牵引力,单位为kW/t。精细的VSP分类和分布集成,可以用来反映驾驶员之间在不同速度下的差异。
 (1)
(1)
 (2)
(2)
其中,v是车辆的瞬时速度,单位为m/s;a是加速度,单位为m/s2;g是重力加速度;θ是道路坡度;A、B和C是道路载荷系数。
VSP分布被定义为每个VSP区间在特定交通条件下所花费的时间比例。图1展示了总体样本在全速度区间的VSP分布情况。
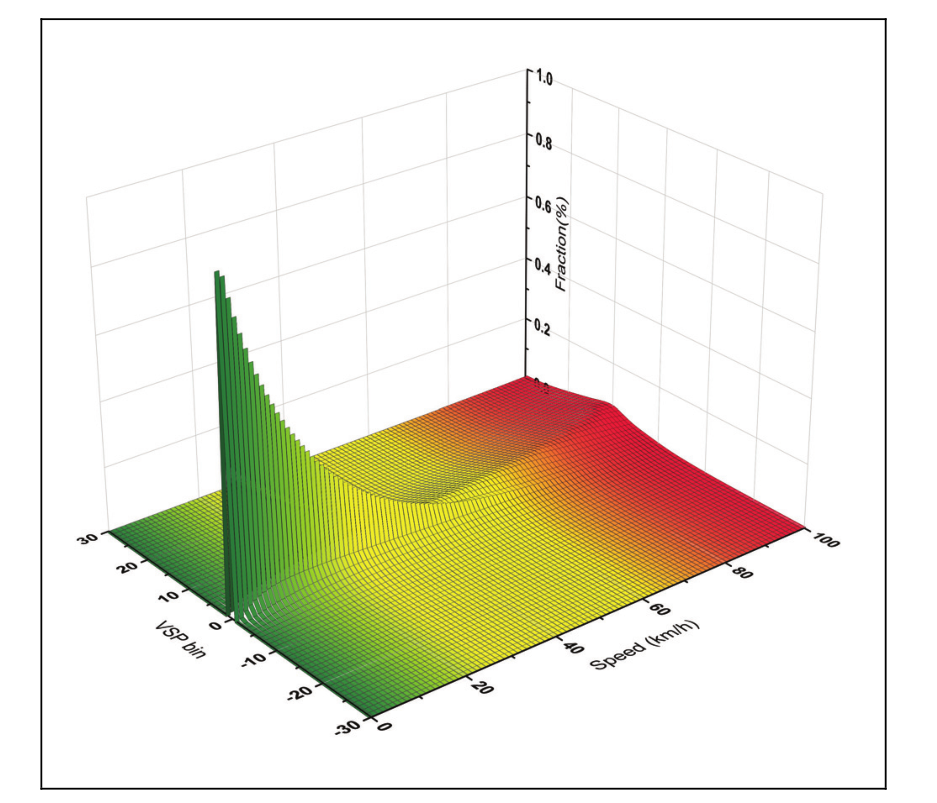
图1 总样本在全速度区间的VSP分布图
2.3 驾驶行为异质性区分
不同的VSP分布反映了不同驾驶员的驾驶行为差异。因此,本节从能耗的角度来介绍表示这种异质性的方法,设计了一个指数来反映每个驾驶员的能耗效率,并使用SOM算法对具有相同特征的驾驶员进行分组。
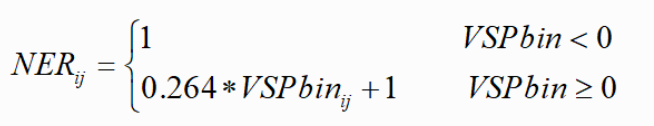
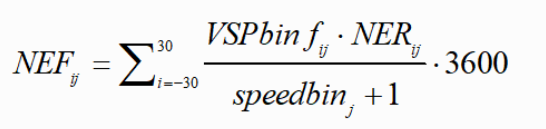
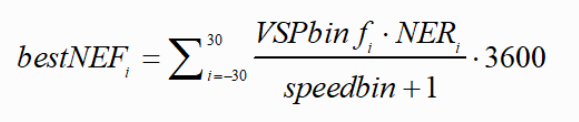
本研究采用碳平衡方法,从北京交通大学开发的排放数据库中计算出燃油车的瞬时能耗率,该数据库使用便携式排放测量系统收集了2003至2016年的数据。为了消除车辆类型和燃料类型对总能耗的影响,在图2中展示了每个VSP区间的平均轻型车的归一化能耗率(Normalized Energy Rates, NER)。归一化能耗系数(Normalized Energy Factor, NEF)是利用归一化能耗率和特定速度的VSP分布来定义的,单位为g/km,并设计了一个指标来对比不同速度段的能耗效率。在固定的平均速度区间下,车辆在没有加减速的巡航速度下保持能耗最优;这个最优的NEF如公式(5)所示。该指标反映了在确定的速度下,驾驶员能耗指标与最佳NEF的相对差异,如公式(6)所示。不同驾驶员的能耗效率指标的差异反映了驾驶员之间的消耗差异,而速度的差异则显示了每个驾驶员的异质性。此外,能耗指数被定义为指标与每个速度段的时间分数的乘积之和,如公式(7)所示。
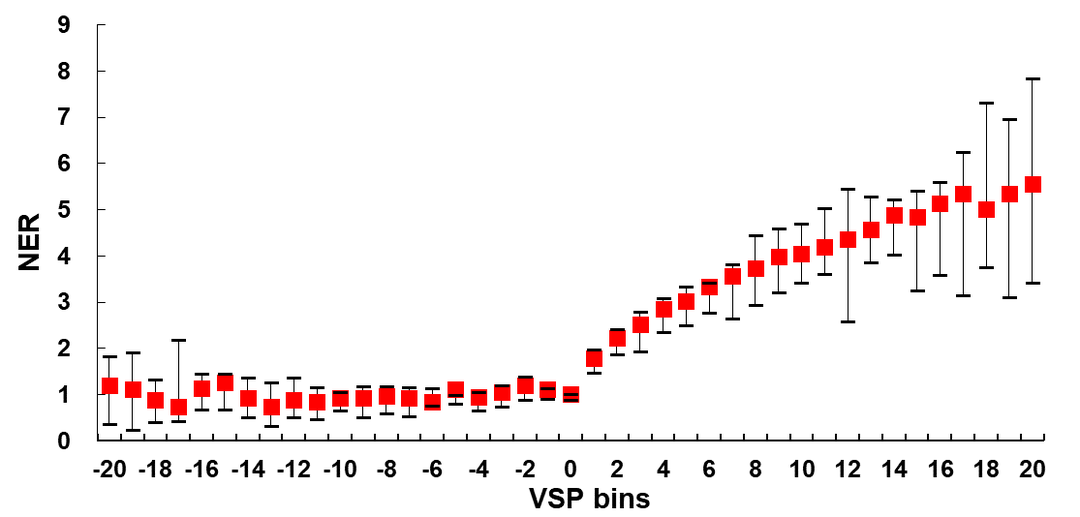
图2 轻型车辆的NER变化(含95%的置信区间)
 (3)
(3)
 (4)
(4)
 (5)
(5)
 (6)
(6)
 (7)
(7)
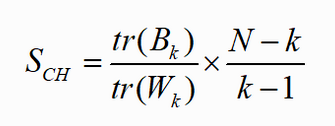
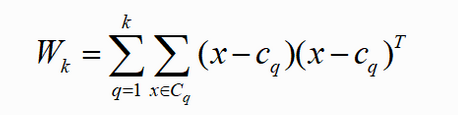
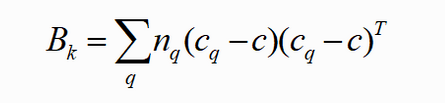
采用SOM算法的聚类方法区分驾驶员之间能耗效率的指标差异,该方法可以使高维数据更容易被可视化和分析,特别是对不同速度的能耗效率指标。使用Calinski-Harabasz(CH)分数来衡量聚类结果,如公式(8-10)所示。该分数被定义为组间离散度与组内离散度之比,分数越大说明聚类效果越好。
 (8)
(8)
 (9)
(9)
 (10)
(10)
其中,向量x在聚类Cq中,Wk是聚类内离散度,Bk是聚类间离散度平均值,SCH是Calinski-Harabasz分数。
3 研究结果
3.1 速度区间能耗异质性
本研究计算了中速度区间(10-60 km/h)内的能耗效率指标,在相同的条件下,驾驶员之间存在规律性的显著差异(本文以北京为例收集数据,不同地区之间可能存在更大的差异)。通过SOM算法将驾驶员聚类,由图3可知,节点为9时可以获得更详细的分类效果。
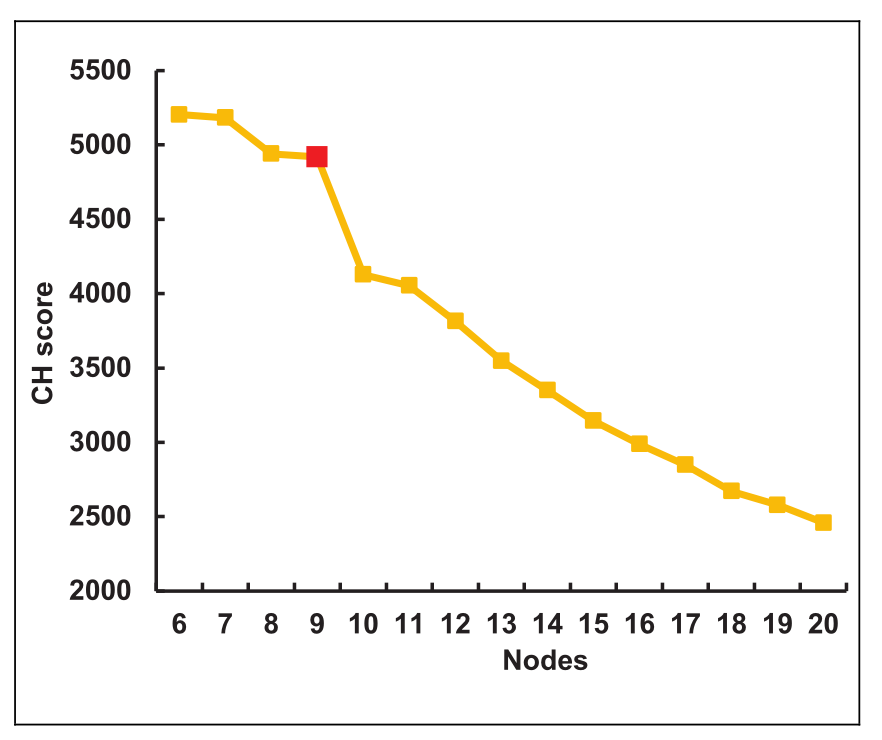
图3 不同聚类节点的CH值变化曲线
图4中9号组的平均曲线显示出能耗效率平均指标最大值的差异和最耗能速度下的差异。对各组的平均曲线进行多项式回归,各组R方均大于0.98。最耗能的速度区间在35km/h到45km/h之间,这意味着大多数驾驶员都在这个速度范围内消耗最多的能量。9号组的能耗效率平均指标最高,在41.3km/h时达到32.6%。例如,对于9号组的驾驶员,如果使用平均(默认)VSP分布计算,能耗将被低估6.43%。
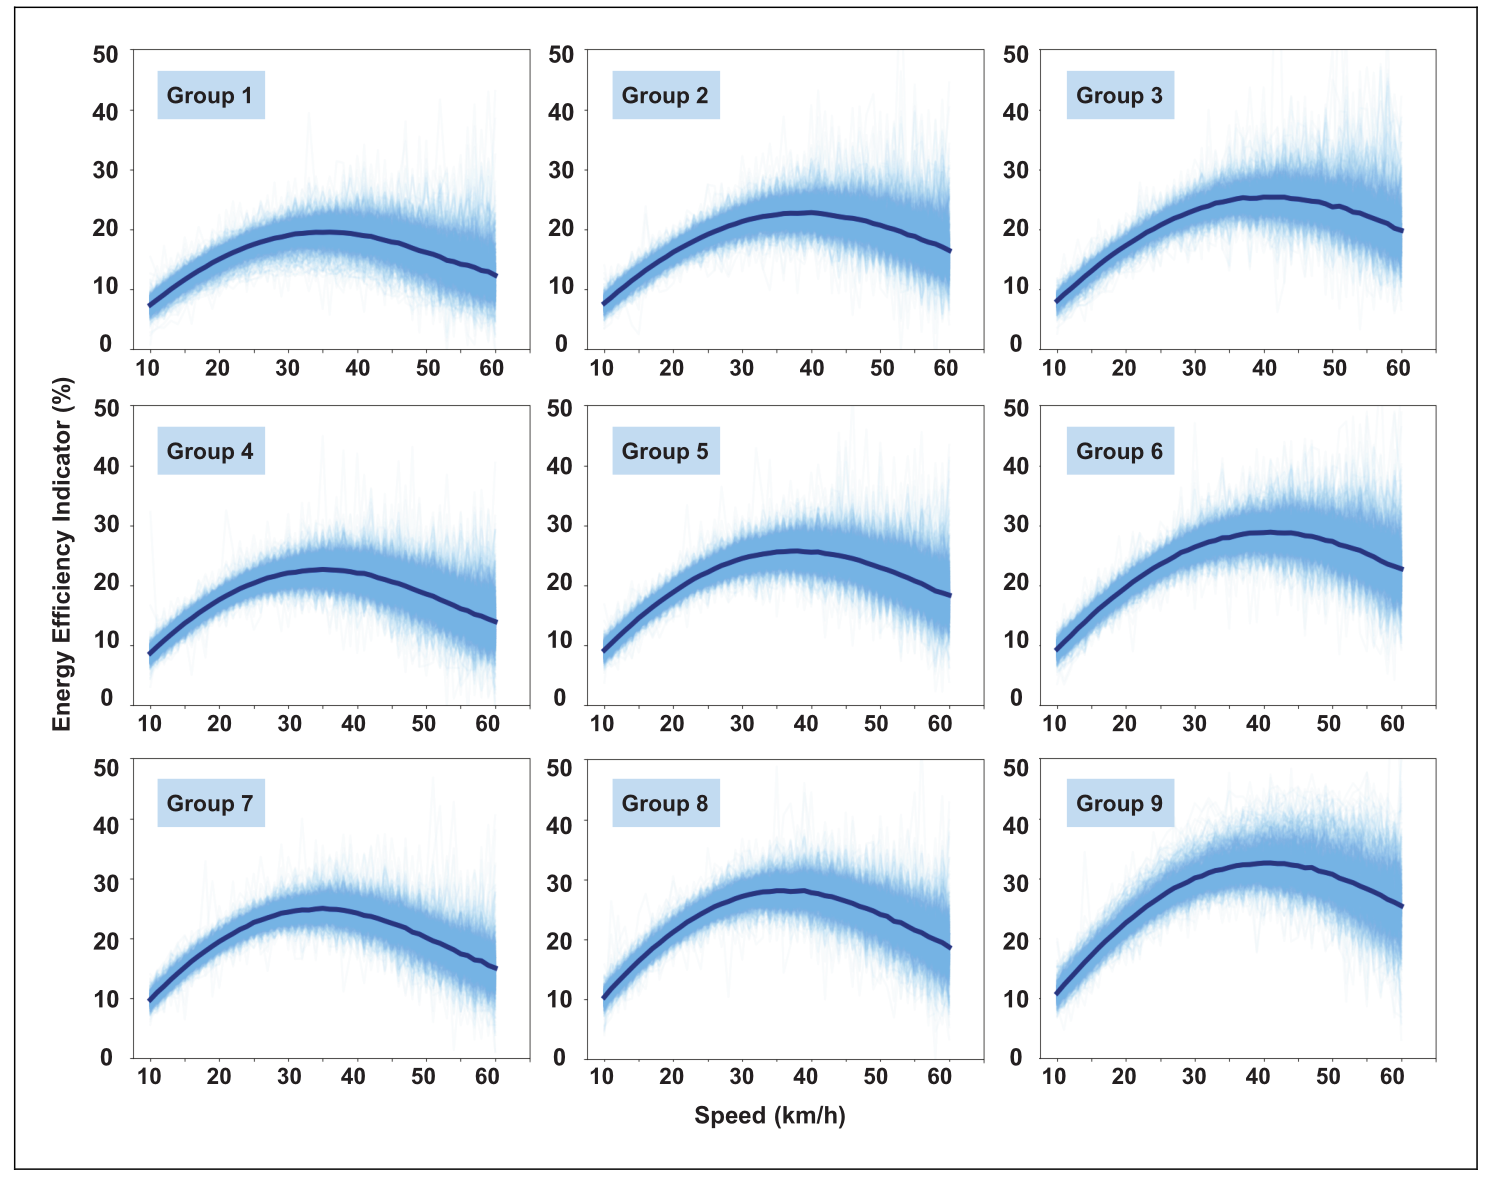
图4 特定速度下能耗效率指标的SOM聚类结果
3.2 车辆类型间的能耗异质性
假设三类车辆在相同的驾驶行为下具有相同的能耗效率,基于逐秒的车辆活动数据,计算每种类型车辆的能耗效率指标,比较结果如图5所示。
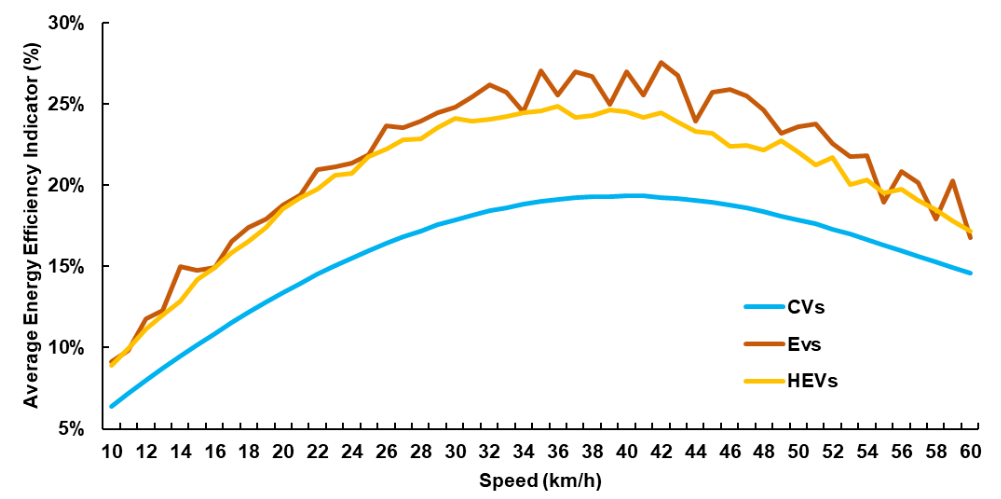
图5 燃油车、电动车和混合动力车在特定速度下平均能耗指标的对比
VSP分布差异反映出燃油车驾驶员的驾驶行为相对于其他两类车来说是非常生态和经济的。燃油车和电动车之间的差异超过了5%,当速度为40km/h时达到了9.4%。电动车和混合动力车的指标曲线在数值和趋势上都非常相似。对速度为10、20、30、40、50和60km/h时的VSP分布进行了比较,如图6示,电动车和混合动力车的VSP分布在不同的速度区间都比燃油车更分散,特别是当速度为10km/h或20km/h时。电动机可以在低速时提供高的加速度,导致驾驶周期中的速度波动,这解释了燃油车与电动车在驾驶行为上的差异。
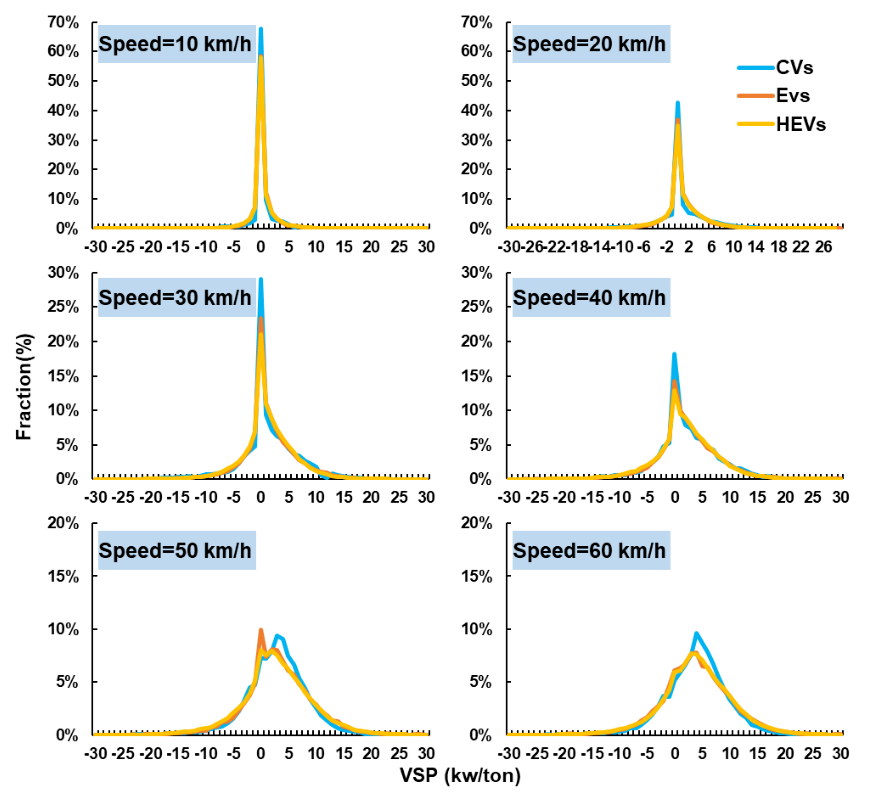
图6 速度为10、20、30、40、50和60 km/h时三类车辆的VSP分布对比
由于电动机的性质,电动车可以在低速时产生高扭矩。相比之下,燃油车在低速时不会产生很大的扭矩,所以在低速时,电动车的加速度要比燃油车大。不同车辆类型的异质性反映出,更激进的驾驶行为发生在非燃油车中,但这些车辆仍缺少针对性的能耗测算模型。
3.3 能耗差异案例分析
使用由轻型车默认的功率分布(不区分驾驶员异质性)估计的能耗值作为对照组,再使用区分了异质性的VSP分布来估计能耗,与对照值相比,每组的相对误差限如下图所示。
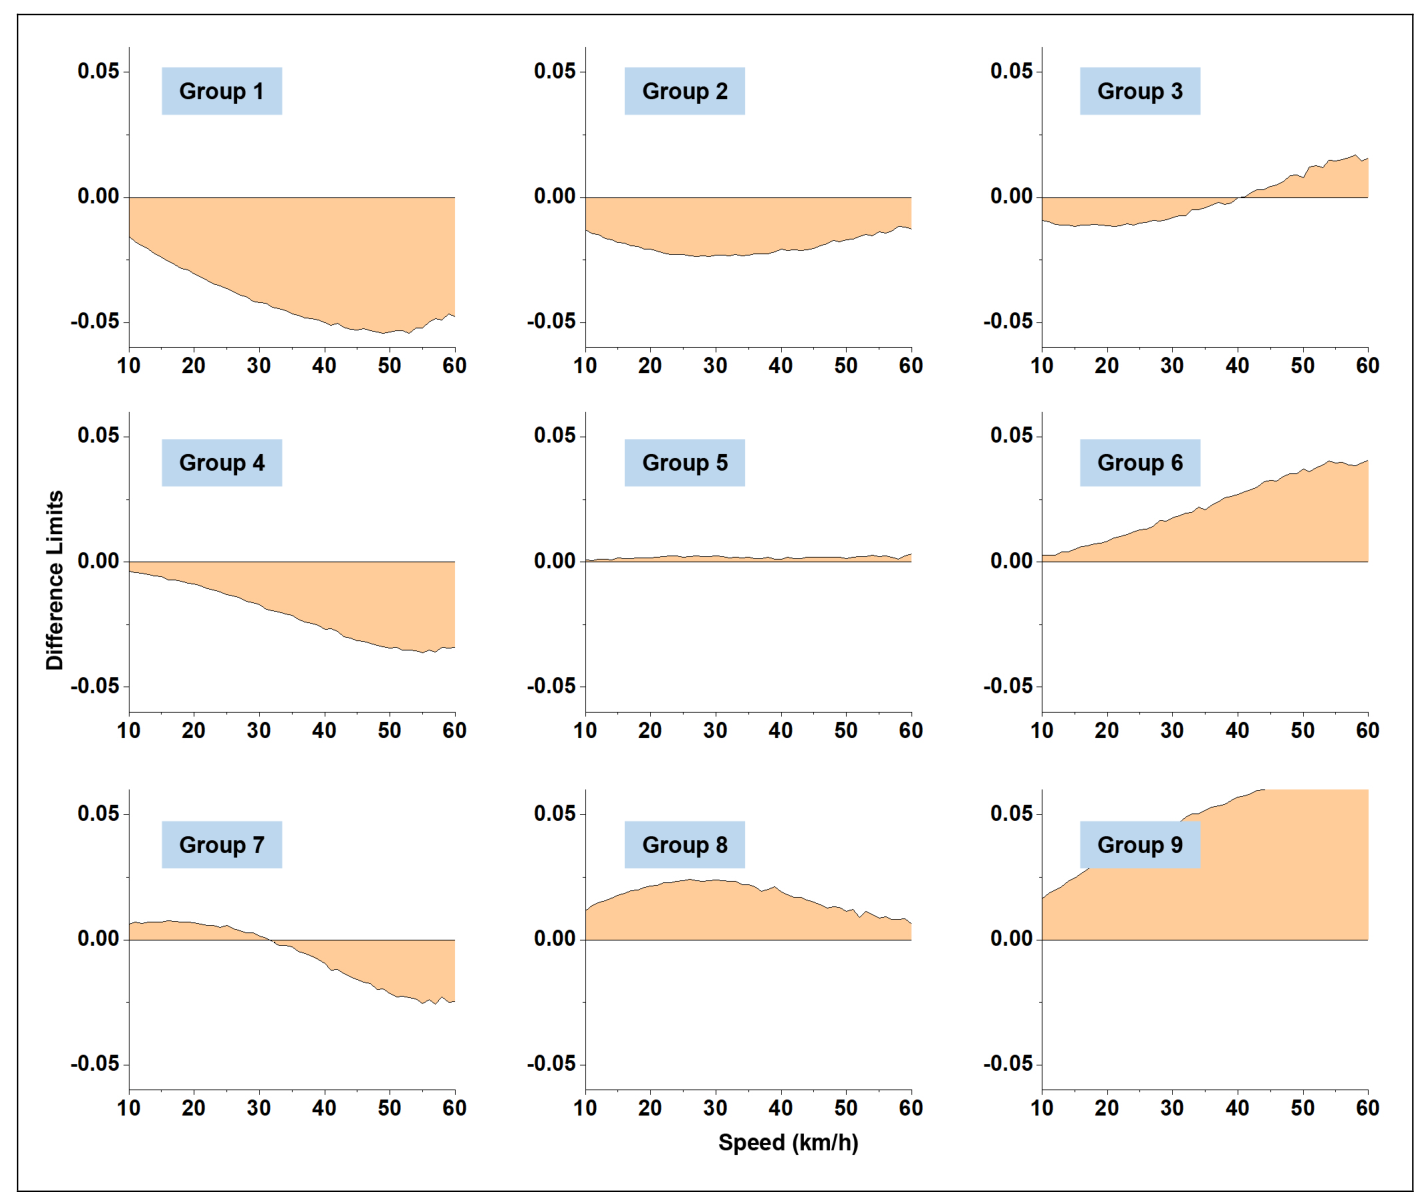
图7 与对照组相比9类驾驶员的能耗估计相对误差限
图7反映了区分异质性的不同组别和默认功率分布之间能耗消耗的相对差异。5号组在中速度区间内显示出高度的同质性,即5号组的驾驶员和默认功率分布具有相似的VSP分布,除5号组外,其他组的平均能耗在10-60km/h速度段有明显的相对差异,50km/h时最大差异达到6.43%。
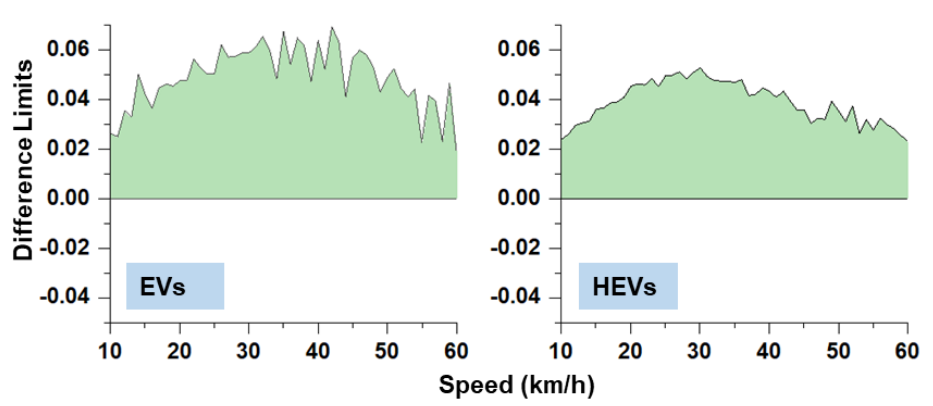
图8 电动车和混合动力车的能耗估计相对误差限
图8中比较了由于不同类型的车辆而导致的能耗计算的差异。电动车和混合动力车具有敏感的速度响应,更分散的加速度分布,以及激进的驾驶行为。因此,如果使用MOVES提供的默认功率分布,车辆的能量消耗将被低估6%。
4 结论
驾驶行为的异质性可能导致使用默认功率分布的轻型车能耗测算出现误差。为了分析驾驶行为异质性导致的能耗测算的不确定性,我们根据特定速度的VSP分布,设计了一个反映能耗效率的指标,并讨论了基于无监督算法聚类的驾驶员的异质性。本文的研究结论可以归纳为以下三点:
(1)个人驾驶行为的差异显著反映在随速度变化的VSP分布上。
(2)电动车和混合动力车与燃油车相比表现出明显的异质性,当速度低于60km/h时,驾驶员的驾驶行为更为激进。如果忽略这种异质性,电动车和混合动力车的能耗将被低估约6%。
(3)驾驶员的驾驶行为在不同速度下的能耗效率方面呈现异质性。大多数驾驶员在35-45km/h时,能耗效率指标达到极高值。如果忽略了这种异质性,在能耗估计中会出现高达6.34%的误差。
参考文献
1. United States Environmental Protection Agency. Population and Activity of On-Road Vehicles in MOVES2014. EPA-420-R-16-003a. Environmental Protection Agency, Washington, DC, 2016.
2. Jime´ nez-Palacios, J. L. Understanding and Quantifying Motor Vehicle Emissions with Vehicle Specific Power and TILDAS Remote Sensing. PhD dissertation. Massachusetts Institute of Technology, Cambridge, 1999.
3. Yao, Z., H. Wei, Z. Li, T. Ma, H. Liu, and Y. Yang. Developing Operating Mode Distribution Inputs for MOVES with a Computer Vision-Based Vehicle Data Collector. Transportation Research Record: Journal of the Transportation Research Board, 2013. 2340: 49–58.
4. Taylor, J., X. Zhou, N. M. Rouphail, and R. J. Porter. Method for Investigating Intradriver Heterogeneity Using Vehicle Trajectory Data: A Dynamic Time Warping Approach. Transportation Research Part B: Methodological, Vol. 73, 2015, pp. 59–80.
5. Chiabaut, N., L. Leclercq, and C. Buisson. From Heterogeneous Drivers to Macroscopic Patterns in Congestion. Transportation Research Part B: Methodological, Vol. 44, No. 2, 2010, pp. 299–308.
6. Wang, H., W. Wang, J. Chen, and M. Jing. Using Trajectory Data to Analyze Intradriver Heterogeneity in CarFollowing. Transportation Research Record: Journal of the Transportation Research Board, 2010. 2188: 85–95.
7. Kim, I., T. Kim, and K. Sohn. Identifying Driver Heterogeneity in Car-Following Based on a Random Coefficient Model. Transportation Research Part C: Emerging Technologies, Vol. 36, 2013, pp. 35–44.
8. Zang, J., G. Song, Y. Wu, and L. Yu. Method for Evaluating Eco-Driving Behaviors Based on Vehicle Specific Power Distributions. Transportation Research Record: Journal of the Transportation Research Board, 2019. 2673: 409–419.
9. Zhang, J., Y. Wang, and G. Lu. Impact of Heterogeneity of Car-Following Behavior on Rear-End Crash Risk. Accident Analysis and Prevention, Vol. 125, 2019, pp. 275–289.
10. Yang, H., Y. Wu, H. Xiao, and Y. Zhao. Simulation Study of Rear-End Crash Evaluation Considering Driver Experience Heterogeneity in the Framework of Three-Phase Traffic Theory. Journal of Advanced Transportation, Vol. 2021, 2021. https://doi.org/10.1155/2021/5533722.
11. Lei, X., G. Song, Z. Zhai, Y. Wu, and Z. Li. Eco-Routing Method for Electric Vehicles Based on the Distribution of Vehicle Specific Power: A Case Study in Beijing. Presented at 100th Annual Meeting of the Transportation Research Board, Washington, DC, 2021.
12. Zhai, Z., G. Song, Y. Liu, Y. Cheng, W. He, and L. Yu. Characteristics of Operating Mode Distributions of Light Duty Vehicles by Road Type, Average Speed, and Driver Type for Estimating on-Road Emissions: Case Study of Beijing. Journal of Intelligent Transportation Systems: Technology, Planning, and Operations, Vol. 23, 2019, pp. 191–202.
13. Haque, M. M., A. D. Ohlhauser, S. Washington, and L. N. Boyle. Decisions and Actions of Distracted Drivers at the Onset of Yellow Lights. Accident Analysis and Prevention, Vol. 96, 2016, pp. 290–299.
14. Greene, W. H., and D. A. Hensher. A Latent Class Model for Discrete Choice Analysis: Contrasts with Mixed Logit. Transportation Research Part B: Methodological, Vol. 37, No. 8, 2003, pp. 681–698.
15. Kohonen, T. The Self-Organizing Map. Proceedings of the IEEE, Vol. 78, No. 9, 1990, pp. 1464–1480.
16. Song, G., and L. Yu. Characteristics of Low-Speed VSP Distributions on Urban Restricted Access Roadways in Beijing. Transportation Research Record: Journal of the Transportation Research Board, 2011. 2233: 90–98.
17. Zhai, Z., G. Song, and L. Yu. How Much Vehicle Activity Data Is Needed to Develop Robust Vehicle Specific Power Distributions for Emission Estimates? A Case Study in Beijing. Transportation Research Part D: Transport and Environment, Vol. 65, 2018, pp. 540–550.
18. Li, C., L. Yu, W. He, Y. Cheng, and G. Song. Development of Local Emissions Rate Model for Light-Duty Gasoline Vehicles: Beijing Field Data and Patterns of Emissions Rates in EPA Simulator. Transportation Research Record: Journal of the Transportation Research Board, 2017. 2627: 67–76.
19. Song, G., L. Yu, and Z. Tu. Distribution Characteristics of Vehicle-Specific Power on Urban Restricted-Access Roadways. Journal of Transportation Engineering, Vol. 138, 2011, pp. 202–209.
20. Song, G., L. Yu, and Z. Wang. Aggregate Fuel Consumption Model of Light-Duty Vehicles for Evaluating Effectiveness of Traffic Management Strategies on Fuels. Journal of Transportation Engineering, Vol. 135, 2009, pp. 611–618.
21. Zhai, Z., G. Song, H. Lu, W. He, and L. Yu. Validation of Temporal and Spatial Consistency of Facility- and SpeedSpecific Vehicle-Specific Power Distributions for Emission Estimation: A Case Study in Beijing, China. Journal of the Air and Waste Management Association, Vol. 67, 2017, pp. 949–957.
22. Frey, H., N. Rouphail, and H. Zhai. Speed- and FacilitySpecific Emission Estimates for On-Road Light-Duty Vehicles on the Basis of Real-World Speed Profiles. Transportation Research Record: Journal of the Transportation Research Board, 2006. 1987: 128–137.
23. Yu, L., and G. Song. Data Needs, Issues, and Experiences for MOVES in PM Hot-Spot Analysis. Presented at 91st Transportation Research Board Annual Meeting, Washington, DC, 2012.
24. Frey, H. C., A. Unal, J. Chen, S. Li, and C. Xuan. Methodology for Developing Modal Emission Rates for EPA’s Multi-Scale Motor Vehicle & Equipment Emission System. Report EPA 420-R-02-027. U.S. Environmental Protection Agency, Washington, DC, 2002.
25. Zhang, Z., G. Song, L. Zhang, Z. Zhai, W. He, and L. Yu. How Do Errors Occur When Developing Speed Correction Factors for Emission Modeling? Transportation Research Part D: Transport and Environment, Vol. 101, 2021, p. 103094.
26. Beijing Transport Institute. Beijing Transport Development Annual Report 2020. Beijing Transportation Development Research Institute, China, 2021.
27. Xu, X., J. Li, Y. Liu, and Y. Zhang. The Development of Electric Vehicles Urban Driving Cycle. Science Technology and Engineering, Vol. 17, 2017, pp. 330–336. (In Chinese)
来源:北交CKSRC
供稿:张乐琦